Application of ACREL-3000 in Transformer Distribution System of Suzhou Medical Industry Institute
Du Yundong
Shanghai Ankerui Electric Co., Ltd. Shanghai Jiading
0 Introduction The Suzhou Institute of Biomedical Engineering and Technology of the Chinese Academy of Sciences (hereafter referred to as the Medical Institute) is located in the Suzhou Science and Technology City on the shore of Taihu Lake in the Suzhou High-tech Zone. Biomedical engineering is a pillar industry of the country's major development, and it is in response to the development of the State Council. Energy conservation and emission reduction policies and measures to better monitor and manage the distribution system. Therefore, a background power monitoring and power management system was established to intelligently manage power distribution.
1 The system design transformation and distribution system is mainly controlled by substations in substations A and B. It provides the power required by the entire medical laboratory, and there is a duty room near substation A in the area. It can be viewed and processed in real time. In the case of the site, the entire medical worker occupies a relatively large area, and the electricity in another area is provided by substation B. Therefore, in order to achieve real-time monitoring of the entire medical office power system and power management of various districts, a monitoring center was set up in the duty room, and the entire power distribution system was implemented based on the ACREL-3000 power monitoring and power management system background. Real-time monitoring and power management.
1.1 System Structure The Acrel-3000 power monitoring and power management system provides basic platforms for real-time data acquisition, on-off status monitoring and remote management and control of large-scale public buildings by monitoring hosts, communication equipment, and measurement and control units. The detection and control equipment constitutes an arbitrarily complex monitoring system. The system mainly adopts a hierarchical distributed computer network structure, as shown in Figure 1: station control management layer, network communication layer and field device layer [1].
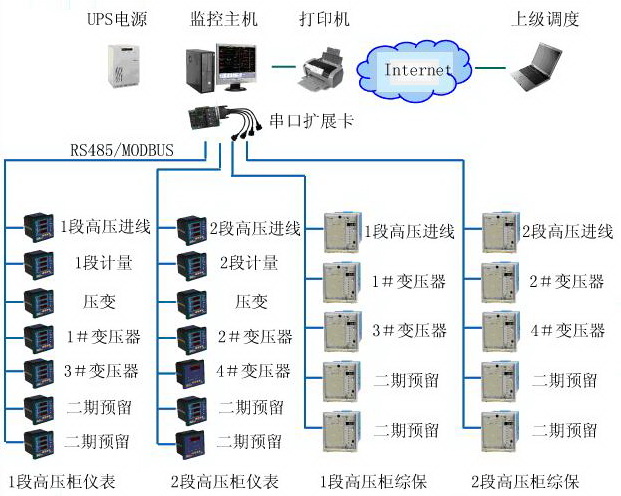
1) Station Control Management Station Control Management The management personnel of the power monitoring system are the direct windows of human-computer interaction and the top of the system. Mainly by the system software and necessary hardware equipment, such as industrial-grade computers, printers, UPS power supply and other components. The monitoring system software has a good human-computer interaction interface, calculates, analyzes and processes various types of data collected on the site, and reflects the operating status of the site with graphics, digital display, and sound.
Monitoring host: used for data acquisition, processing and data forwarding. Provides data interfaces within or outside the system for system management, maintenance, and analysis.
Printer: The system calls for printing or prints graphics, reports, etc. automatically.
UPS: Ensures the normal power supply of the computer monitoring system. When power supply problems occur in the entire system, ensure the normal operation of the station control management equipment and provide sufficient time for data storage.
2) Network communication layer The communication layer device is a serial port expansion card. This layer is a bridge for data information exchange. It is responsible for the collection, classification, and transmission of data information sent back by field devices, and it also conveys various control commands from the upper computer to the field devices.
Communication medium: The system mainly adopts shielded twisted pair, uses RS485 interface and MODBUS communication protocol to realize real-time communication between field device and host computer.
3) Field device layer The field device layer is a data collection terminal, which is mainly composed of smart meters. It uses a highly reliable distributed I/O controller with a field bus to form a data collection terminal, and uploads the collected data to the data center. . The measuring instruments are responsible for the most basic data collection tasks. The data they monitor must be complete, accurate and transmitted to the monitoring host in real time.
1.2 On-site instrumentation For line protection of medium-voltage 10 kV loops, a microcomputer relay protection device is used to achieve over-current protection of the line, with telemetry and remote signaling capabilities. Switching quantity: Signals such as the state of the circuit breaker and the status of the isolated handcart. For the energy measurement of the circuit, the ACR220EL power meter is used to collect and measure the electrical parameters. The main parameters to be collected include three-phase voltage, three-phase current, active power, reactive power, active power, reactive power and frequency. Power factor and so on.
For the 0.4kv transformer outlet circuit, ACR220EL power meters are used, and ACR220EL multi-function electricity meters are embedded. They can be installed on the power box or low-voltage outlet cabinet door panel. The panel size is 80mm×80mm and the specification is 220/380V. 5A, current through the transformer access, accuracy of 0.5, widely used in high and low voltage line cabinets, contact cabinets, outlet cabinets, power cabinets and other occasions, with RS485 interface, Modbus communication protocol [2].
2 System function The upper computer software is the configuration software of Acrel-3000 power monitoring and power management system. This software is special software for collecting and monitoring on-site electrical parameter data. The biggest feature is that it can be flexible and diversified. Instead of programming methods for system integration, it provides a good user development interface and a simple way to implement the project. As long as the preconfigured various software modules are simply “configuredâ€, they can be easily implemented and completed. On-site data acquisition and monitoring capabilities. Acrel-3000 power monitoring and power management system has a friendly human-machine interface, which can collect real-time and time-sequenced parameters of the field devices and switch status, and upload the collected data to the monitoring host for real-time display and storage. The system also provides analysis of real-time curves and historical trend curves, and meets the functions of reports, event records, and fault alarms required by users' designs [3]. The entire system can realize the collection and statistics of all circuit power consumptions, and realize remote automatic meter reading, power monitoring and power management functions.
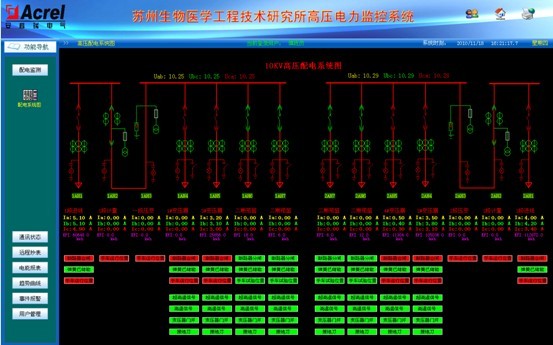
1) Data acquisition and display The field instrument measures and collects loop data information. The PC software then collects and stores the data of the field instrument at regular or periodic intervals. The collected time period can be set freely and the minimum system supports the acquisition period. You can view any meter's instantaneous table value, accumulated amount, and other information at any time, and record the voltage, current, power factor, and active power of the power meter within the time interval. These parameter information can be automatically saved to the database for easy querying.
The system has a friendly man-machine interface, which is convenient for ordinary on-site personnel to view and record relevant information. The system one-time diagram not only shows the on/off state of the line, but also displays important power parameters such as voltage, power, and active power in real time. All data information is regularly saved to the database.
2) The remote meter reading system can display all the collected data in real time and store it in the database. Therefore, all the real-time and historical electrical parameter data of each loop can be manually queried and presented to the user in the form of a table. Print, save.

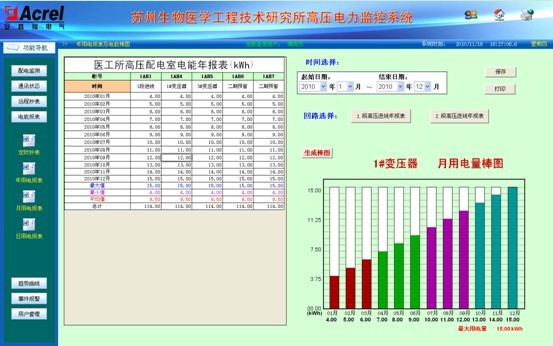
3) The active energy data collected by the energy report and the bar graph system, according to the different names of the loops, automatically generate the daily report, monthly report and annual report, and have the report printing function, and can be in a certain time period of a certain loop. Use electricity to query and print, and these reports can also be exported in Excel format.
The system can also generate annual electricity bar graphs, monthly electricity bar graphs, and daily electricity bar graphs for easy viewing based on the generated electrical energy reports.
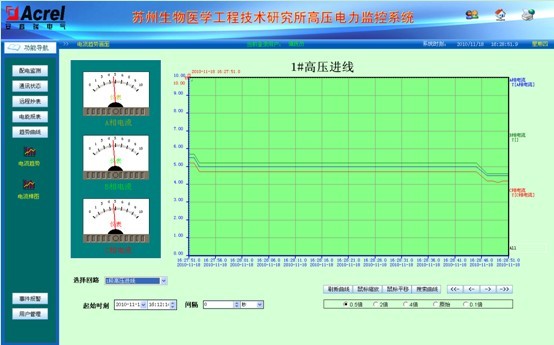
4) Current trend curve For important loops, not only can the current be displayed and monitored in real time, but also trend curves can be created from saved historical data, real-time and historical changes can be viewed, power load capacity can be predicted, and power failures can be performed. Inquiries to ensure the safe operation of the power load.
5) Event records and alarms are mainly used to view historical alarm information; assist users in inquiring and recalling accidents; support history query, print, and other functions. Real-time alarm information will pop up immediately to remind the user of the operation. And it has automatic event logging for all operations.
3 Conclusion With the development of intelligent buildings and the widespread use of electricity, the intelligent integrated management of the distribution system of intelligent buildings has become an inevitable trend for the intelligent construction of government office buildings and large-scale public buildings. This article is based on the introduction of ACREL-3000. The power monitoring and power management system can not only display the power running status and power usage status in real time, but also analyze and process the data, display it in a user-applicable manner, meet the user's needs, and realize the analysis and processing of the collected data. It generates a variety of energy reports, analysis curves, graphics, etc., which greatly facilitates the use of the user, and facilitates real-time monitoring of power distribution systems and remote meter reading and analysis of electrical energy, providing reference for energy-saving technologies in smart buildings.
references
[1] Wang Bin, Du Yundong, et al. Design and application of energy monitoring system for large-scale public buildings based on Acrel-5000 [J]. Intelligent Building Electrical Technology. 2009.3(5)
[2] Ren Zhicheng, Zhou Zhong, Principles and Application Guide for Digital Meters for Electric Power Measurement [M]. Beijing. China Electric Power Press, 2007. 4
[3] Zhou Zhong. Du Yundong. Application of Electric Power Meters in Energy Metering of Large-scale Public Buildings [J]. Modern Building Electric 2010. 6
Learn more please contact us!
Shanghai Ankerui Electric Co., Ltd. Address: No. 253, Yulu Road, Madong Industrial Park, Jiading, Shanghai Contact: Luo Rui
contact number
Cell phone
QQ
Want Want number: acrellr
mailbox:
fax number