From a historical point of view, the debugging process of embedded application code can be divided into two categories. The first type of debugging process is to answer the question "Where is my code now?". This is often the case when a developer relies on print statements or blinking LEDs to indicate that the application is executing a debug method to a node. If the development tool supports this debugging method, breakpoints can be inserted along the path where the application should execute. The second type of debugging process is to help answer the question “Where did I see this value come from?â€. In this case, people often rely on the register display window to observe the variable information and the contents of the processor's memory. One can also try to step through and observe all of these data windows to see when a register state has an error, when the memory location gets the wrong data, or when the pointer is misused.
After the developer writes the complete code, if there is no need to understand the network infrastructure and there is no task scheduling of the operating system to be considered, then these debugging methods can be used to make an application run. However, this is not the case now. Embedded processors run at speeds exceeding 600 MHz and have embedded peripherals that support protocols such as Ethernet and USB. They support a full-featured operating system such as uClinux, and the various applications that these operating systems dispatch are It consists of thousands of lines of code. Using print statements and debugging with LEDs is unrealistic because it is often impossible to perform so many functions now, or they can affect the standard I/O ports, resulting in a significant reduction in processor performance.
It may also happen that the processor's working speed is so fast that the LED's blinking speed is so fast that the human eye cannot detect it. In addition, modern embedded systems usually support the setting of breakpoints, but along with the amount of code that these processors run, this type of breakpoint debugging is difficult to control. Interrupts and multi-threaded systems Setting a breakpoint at any point in the code may not indicate the correct state of the system. Because the breakpoint is set at an address in physical memory, the index does not have to know the state of the thread. If you use the register display method, then the local variable window and the memory window will help to isolate the inappropriate amount of load, but because these are static tools, they can't give meaningful running debugging information. Its applicability is also often limited.
The most common debugging problems for real-time embedded system software can be roughly divided into the following categories:
1. Synchronization issues 2. Memory and register corruption
3. Interrupt-related issues 4. Hardware configuration issues 5. Anomalies
Synchronization issues
In any system, as long as there are multiple serial threads or processes running and asynchronous data sharing, the system must have synchronization problems. All operations on shared data must be atomized, that is, other threads can operate on data only after one thread or process completes data operations.
Taking Figure 1 as an example, thread A and thread B operate on the shared variable "counter", A increments the counter, and B decreases the counter. The assembly code for thread A's counter++ and thread B counter is shown below. Assuming that thread B has a higher priority than thread A and thread A is currently running, thread B will be blocked.
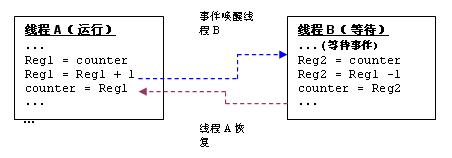
For example, suppose the initial count value is 2, and thread A is the execution thread. Thread A reads the count value and sends it to a register, after which it adds an increment and then writes it back to the counter variable.
In a preemptive multi-threaded system, execution of high-priority threads can preempt low-priority threads. For example, assume that an event wakes up thread B after thread A executes the Reg1 = Reg1+1 instruction. At this point, Reg1 stores a value of 3. Thread B is now woken up (as indicated by the blue line) and reads the counter's value 2 (it has not been refreshed by thread A) and reduces its magnitude to 1. As shown by the brown line, after a period of time, thread A resumes running and Reg1 is written into the counter, which has a storage value of 3. In this process, the result of thread B's decrement operation is discarded. The value stored by the counter becomes 2, that is, after thread A increments, thread B performs another decrement operation. A tampered link table is another example. The above problem can also occur if data is shared by a thread and an interrupt routine because the execution of the interrupt is asynchronous to the execution of the thread.
Synchronization issues are often difficult to debug because they depend on timing and randomly appear as the software manipulates the data. Fortunately, these problems can be avoided by properly protecting any shared data. Most real-time operating systems can provide synchronization primitives. Developers can use the most appropriate mechanism to protect shared data without affecting system performance. If data is shared among multiple threads, the developer will have the following options:
a. Turn off the scheduler so that the current thread is never preempted by other threads. (No scheduling area)
b. Use Semaphore or mutex to protect the shared data.
c. Use key areas for protection, ie block all interruptions.
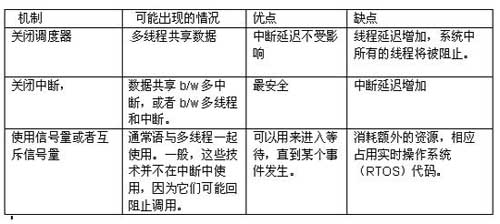
Developers must choose the right technology options based on performance. Turning off the scheduler will prevent any kind of environment from switching, so that the current thread can continue to execute until the scheduler is reopened. This method has a negative effect: it will block any high-priority threads that are ready to run. This phenomenon is called priority inversion. Shutting down the interrupt is the safest method and is ideal for short execution times. Thus, the worst-case interruption delay is the sum of all the interruptions that have not occurred. In hard real-time systems, in general, there is an upper limit to the time an interrupt function can be shut down.
One trick for debugging is that if the shared data is corrupted, the programmer should first check out any one of multiple threads or interrupt simultaneous operations on the shared data. If threads and interrupts share data, then the interrupt must be closed in the thread code. If data is shared between multiple interrupt routines, the interrupt should also be disabled because high-priority interrupts can preempt low-priority interrupts.
In a multi-threaded system, high-priority threads can rush ahead of low-priority threads. Therefore, if data is shared among multiple threads, some appropriate mechanism must be used to protect the shared data.
Another synchronization issue is related to inappropriate allocation of thread priorities. It should be ensured that the system's initialization thread is started within the boot time and complete the initialization of the entire system before generating other higher priority threads. For example, if a low-priority site for configuring a device is grabbed by a high-priority thread using the device, the configuration may complete and may cause the device to malfunction. To avoid this situation, developers should use the semaphores or other synchronized primitives supported by the operating system.
Memory and register data corruption
Most embedded systems use a flat memory model and do not have a memory management unit (MMU), so there is no hardware-supported memory protection mechanism. Even with processors that provide this functionality, developers need to protect certain memory areas. Processes and threads will have full access to the memory space of other processes and threads. This may cause various kinds of memory corruption problems described below.
Stack overflow
The runtime stack is a scratch space used in the function call process to store local variables. The hardware register pointer (SP) will track the address of the stack pointer. If you are programming in a high-level language, such as C-voice, the code generated by the compiler will use a stack consistent with the C language runtime model. The runtime pattern defines how variables are stored on the stack and how the compiler will use the stack. Local variables are placed on the current stack. The examples given below describe some of the critical memory used on the stack.
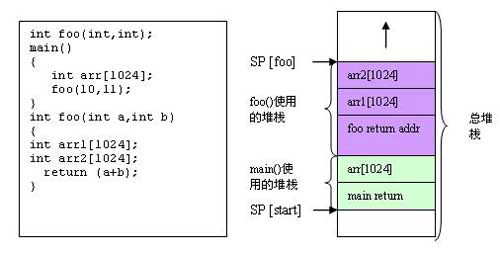
Stack overflow occurs when the stack pointer exceeds its specified boundary. This will cause memory corruption and eventually cause the system to fail. In the above example, a stack overflow occurs if the total stack memory area is not enough to hold all the local variables.
One trick of debugging is that if you are concerned about overflow, it is a good practice to arrange the stack on memory boundaries so that if an overflow occurs during debugging, the emulator will trigger a hardware exception.
One trick that developers can use is that if you are worried about the overflow of the stack, you should consider putting it on a valid memory boundary. In this way, when the stack overflows, the device will report a hardware anomaly, instead of causing corruption of other memory space.
In stand-alone applications, the runtime stack may be sufficient. However, when using any real-time operating system, each thread and process will have its own stack. For performance reasons, the stack size of most embedded real-time operating systems is determined in advance and cannot be dynamically expanded during operation. This means that if the stack size chosen for a particular thread/process is not appropriate, a stack overflow will occur.
If the application uses a lot of local variables (such as arrays and large structures), it will have to allocate the space of the stack proportionally. One can use malloc() to allocate memory, or set it as a static global variable. The exact method depends on the actual application.
Some real-time operating systems may provide debugging features, such as protection bits, to form a protection against stack overflows. These operating systems either record error messages about stack overflows or submit an exception report to dynamically add stacks. At the very least, most current real-time operating systems can report on the stack and the stack that has been used by threads and processes.
In any interrupt-driven system, the allocation of the stack must take into account the space used by the interrupt service routine. If the interrupt routine is designed to use the current execution object stack, in this case, each thread or process must have a minimum stack size greater than or equal to the stack size plus all interrupts required by the execution object. The routine accumulates the maximum stack size required.
Embedded system developers must master a variety of application link libraries. For example, a third-party library may assume that it has space on the stack.
Interrupt service routine code writing problems:
In embedded systems, interrupt service routines are typically written in assembly for performance considerations. Interrupts are asynchronous in nature and can occur at any point during application execution. The most common problem with assembly level interrupt routines is register corruption. The data stored in the registers used in the interrupt service routine must be saved before the registers are used, and these data will be restored before returning from the interrupt service routine. Developers must understand the status register, and any ALU operation will change its status. In this case, the ISR should save its state and restore it as if it were a register that has already been used.
If the interrupt routines are written in C language and their development is to use the current stack, then the developer should guard against the stack overflow situation, that each thread should have enough stacks to meet the interrupt or embedded Set of interrupt stack requirements. The best practice is to make the interrupt routine as small as possible, postpone the processing, and give it to a thread or a lower priority interrupt. During the development process, developers can add diagnostics at the beginning and end of the interrupt to compare the state of the registers in the underlying architecture.
Interrupt nesting allows a high-priority interrupt to preempt low-priority interrupt routine execution. Developers should take into account the peak demand of the stack and allocate enough space for it (considering the worst case that every interrupt in your system is preempted by a higher priority interrupt).
While manipulating memory-mapped registers (MMRs), people often use online assembly to improve performance. For example, when you mask an interrupt, you may want to set the interrupt mask register (IMASK) directly instead of executing the application software programming interface (API) provided by the RTOS. For example, an atom increase or decrease operation is often written in assembly language. In C functions, these macro assemblies may be called, in which case the compiler may not understand the registers used in the macro assembly. So this will cause the register to be corrupted. Some compilers have an expanded version of the assembly and can pass more information about these functions to the compiler, such as registers that have been used, where the code is in memory, and so on. This will allow the compiler to generate the appropriate code.
Sometimes some functions are written in assembly language and will be called by C functions. If the assembly code is not written according to the C function runtime calling convention, ie, as required by the compiler, argument passing may be invalidated and corrupted. For example, the C function runtime model can specify that the first two parameters must be passed through registers R0 and R1, and the assembly implementation must be written in this syntax. In another case, the runtime model may need to store the return address of a function on the stack. If the assembly's implementation does not conform to the runtime model, it may disturb some registers and cause system failure. If developers use mixed-mode languages ​​to avoid this type of problem, developers must be aware of the runtime model.
translater:
Compiler optimization, even if it is logically correct, can sometimes cause problems. This problem is particularly critical when using low-level device drivers. Rearrangement instructions are a common way to achieve higher performance because processors often support multiple instructions in a single cycle. Therefore, the compiler will attempt to dispatch instructions so that all instruction slots are fully utilized, even if this means that the data is loaded long before the register is used, or the memory remains loaded long after the value is calculated. The data. Look at the figure, which describes how this kind of memory movement occurs.
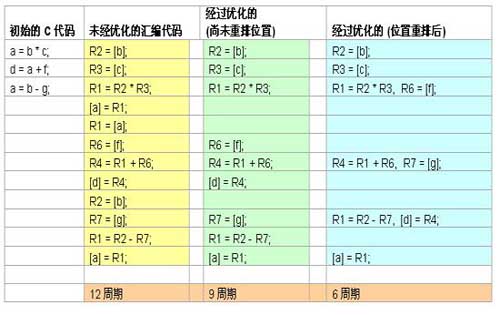
For example, suppose a device must complete initialization before issuing any instructions to it. The compiler may move instruction locations to improve performance. This may cause the device to malfunction. If the debug version of your device driver is workable and a fault occurs when using an optimized version, then you will want to see if there was an instruction to move the device during initialization. You may have to use appropriate compiler guidelines to guide the compiler to perform such optimizations for each basic function without losing performance.
Sometimes porting code from one architecture to another can also cause some sort of data problem. For example, an integer within an architecture may be 32 bits, while other architectures may be 48 bits or 64 bits. This may cause the data to fail or be truncated.
Problems caused by anomalies
If the exception is synchronized with the execution of the program, this is often the result of an improper operation, such as an exception caused by zero as a divisor. Some exceptions are specific to the architecture. The best way to handle exceptions is to use the default exception handler and check for exception conditions when an exception occurs. The context in which the exception is located is the set of register values, including the status register. Most architectures will have an instruction address register that holds the address of the instruction that caused the problem. In most cases, it is not difficult to know how an exception occurs. However, what instruction path can isolate this failure is a tricky part of debugging. Some architectures support tracing, which allows you to see the history of instructions that are executed sequentially by the program. This will give some details of the order of the instructions that caused the exception. Memory and register corruption are the main causes of exceptions and program logic errors. By carefully checking the memory pointers or registers that caused the exception, you can narrow down the problem.
Code that cannot perform error checking can cause memory corruption
Due to performance reasons, developers may give up checking for errors. Skipping the error check will make events such as memory leaks unknown and eventually result in memory corruption. For example, if malloc() fails and the returned value is not verified, the developer will begin to overwrite the amount written to address 0x0 in memory. In many embedded systems, this is valid Memory area. One trick is to let some memory control at address 0x0 to detect any potential fallacy. Some processor architectures allow the application to monitor the activity of the data bus so that it can seize the event.
Explore architecture-specific features
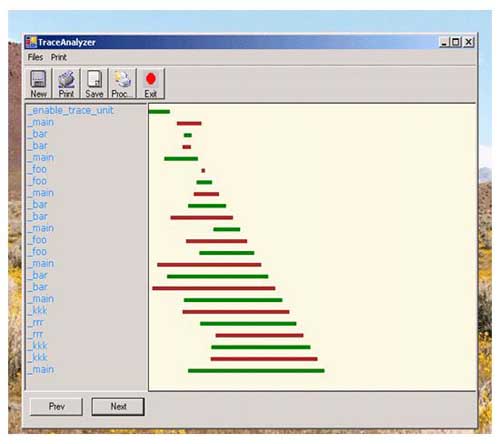
Most embedded processors support some level of debugging. The built-in tracking unit is a tracking mechanism with hardware support. For example, ADI's Blackfin processor family has a hardware tracking unit that tracks access to at least 16 sequential controllers. When the hardware trace buffer is full, a trace exception is generated. With this tracking unit, people can build a complete execution path. The trace output provided comes from a freely available tool (http://) that can construct a complete execution path.
Observation Point
Watchpoints allow you to monitor specific memory locations or what happens when the memory block area is being changed. The watchpoint can monitor the internal data bus transfer, and if there is any matching object found in the watchpoint register, the processor is paused. Watchpoints are useful if there is a constant delay in a particular memory location. Observe the memory block area to see if there is any malicious code that is destroying the memory data.
Most current debugging environments allow modifications to the contents of memory and registers. Sometimes, modifying the contents of registers allows us to see where things go wrong. For example, by changing the program counter, you can force the program to resume execution when a particular function appears. Care must be taken to set the proper value for the appropriate register, depending on the runtime model of the processor's C function. Another useful register is IMASK. If you are debugging any real-time operating system, debugging (step-by-step drill-down) will break at any point in the process. Since the debug code is not necessarily in the critical area, you may access the interrupt routine almost all the time. You may not be able to mask interrupts because they allow your system to set up and run. For example, an interrupt in any system timer may be triggered. A better method is to edit the IMASK register and mask all interrupts until you have finished debugging the code.
in conclusion
In short, since debugging is the final step in the development process, it will have a direct impact on the time to market. Debugging itself is also difficult to schedule, because the problems found are very different in terms of complexity and avoidability. The above discussion is a few common problems during the development of embedded systems. These debugging tips and tips are designed to emphasize time saving, so applying modern development tools and processors with rich debugging capabilities can improve the investment benefits when developing complex embedded systems.
2.00Mm Box Header Connector,Double Row 2.00Mm Box Header Connector,Double Row Dip Box Header Connector,2.0Mm Micro Match Box Header Connector
Shenzhen CGE Electronics Co.,Ltd , https://www.cgeconnector.com